SEED Viewer Manual/Subsystems
Subsystems
A subsystem is a collection of functional roles that are associated to each other in a system. Such a system can for example be a metabolic pathway or a component of a cell like a secretion system.
The subsystem page in the SeedViewer is divided into different parts via a TabView. The TabView can consist of 3-5 tabs. The first tab shows a Diagram of the subsystem, the second tab displays a table with the Functional Roles present in the subsystem. The Spreadsheet relating the functional roles in the subsystem to features in genomes can be found in the third tab. The fourth and fifth tab show a description and additional notes to a subsystem. They only appear if a subsystem has a description / notes. The last tab displays the Scenarios for the subsystem.
Diagram
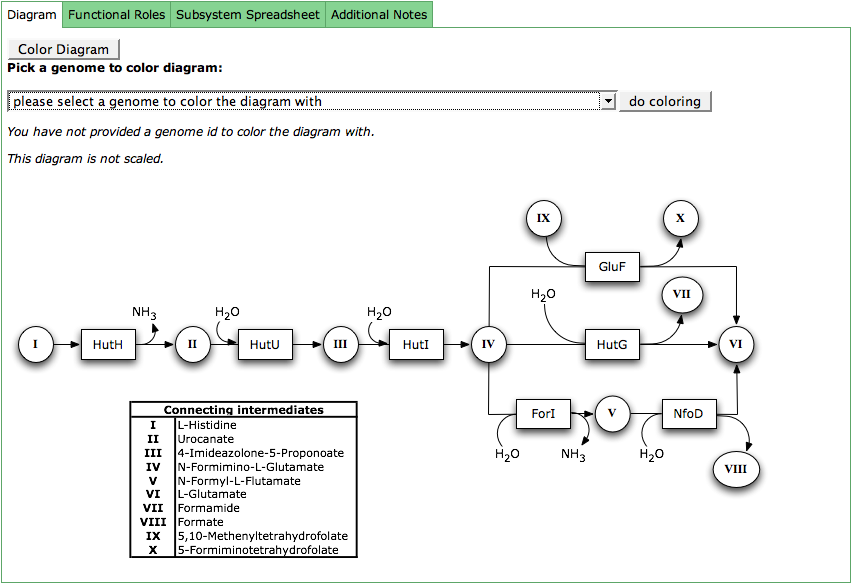
The subsystem diagram shows the connections between the functional roles in a subsystem. The boxes represent the functional roles via their abbreviations. The circles are connecting intermediates, that are described in the table which is part of the diagram.
The functional roles in the diagram can be colored according to their presence in a genome. Click the button Color Diagram to get a combo box with all genomes in the subsystem. Select your genome of interest and press do coloring. The boxes for the functional roles defined for that genome will now be colored in green.
Functional Roles
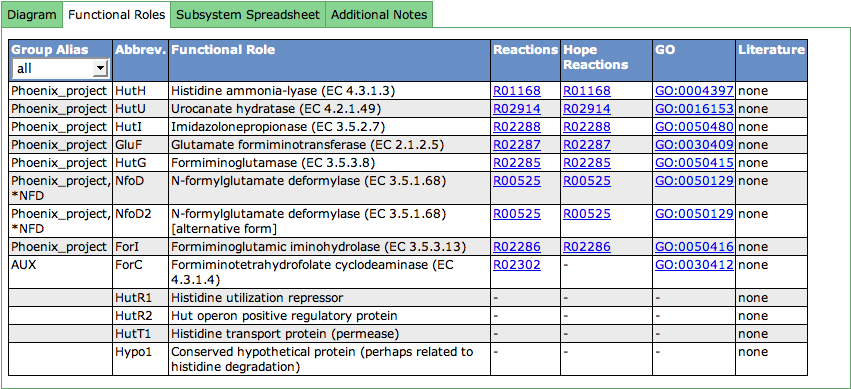
This table lists all functional roles present in the subsystem. The first column shows Group Aliases for the functional role. Functional roles can be aggregated in groups (subsets). Subset names that start with a '*' contain alternative ways to implement a function.
The abbreviation (Abbrev.) for a functional role must be unique for the functional roles in the subsystem. It is used in different displays like the Diagram or the Speadsheet.
The third column lists the full name of the functional role. EC-Numbers are often part of the functional role (for enzymes), and are stated in parentheses after the name of the functional role.
The following two columns deal with reactions a functional role is connected to. Clicking on the link opens a new window showing the KEGG reaction. Next to annotator-curated KEGG reactions, we show the KEGG reactions of the curation effort of the Hope College team that collaborates with the SEED.
GeneOntology (GO) links are displayed in the next column. The links point to the GO-number in GeneOntology's Amigo-Tool.
The last column can contain literature (PubMed IDs) that describes the functional role in detail. If present, you will find a link to PubMed in this column.
Spreadsheet
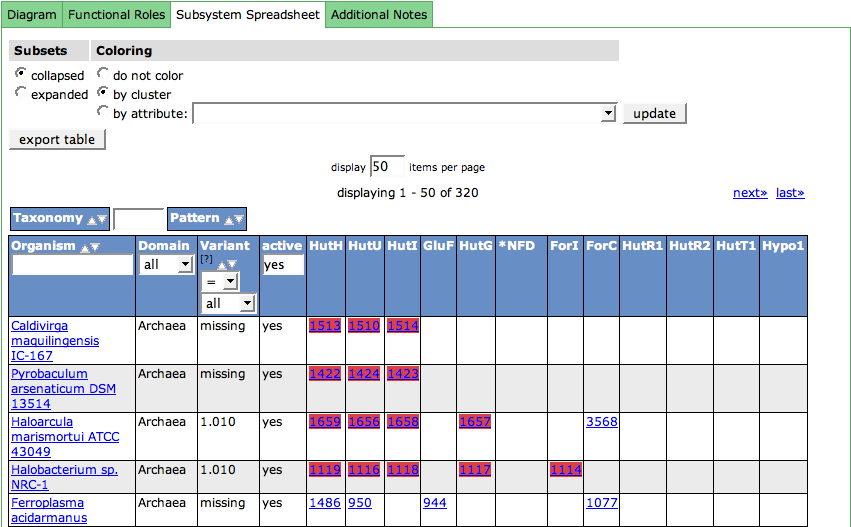
The subsystem spreadsheet displays the features that are assigned with the functional roles in all organisms that are part of the subsystem.
The organisms are displayed in the first column. The links lead to the Organism Page. The column header includes a filter option for the organism, doing an infix search on the organism name.
The Domain (Bacterial, Archaeal or Eukaryote) of the organism is shown in the second column.
For each organism in the spreadsheet, a Variant Code is assigned. Usually, there is more than one way to fulfill a subsystem. Metabolic pathways can have alternatives, or parts of the pathway may be present or absent in an organism. Variant Codes are assigned to the organism to express this behavior. There are two special Variant Codes: 0 and -1.
The Variant Code -1 means that the organism has no active variant of this subsystem, it is not implement this organism.
0 means that the curator has not yet assigned a variant to the genome. Due to the flow of newly sequenced genomes into the SEED, this variant code may show up sometimes.
The next column is used to filter active or inactive variants. If you want to see only the active ones (default), enter yes into the filter in the column header. For seeing only the not active ones, enter no. No input in this field will show all variants.
All following columns in the table show the features in the organisms that are assigned with functional roles. The column headers display the abbreviations of the functional roles (see Functional Roles Table). Hovering over a column header will show a tooltip with the full name of the role. The feature entries in the cells for the functional roles are linked to the Annotation Page for that feature. There can be multiple features in a cell, as some functions are implemented by more that one feature in an organism.
The control table above the spreadsheet table lets you change the display in the table:
Functional Roles that belong to a subset starting with a '*', meaning they are alternatives for a function, are collapsed in the spreadsheet by default. If you want to expand the subsets, you can do so by checking expanded in the Subsets column.
The feature entries in the spreadsheet can be colored according to different metaphors using the second column (Coloring) of the table. By default, the features are colored by cluster. In this case, it is computed which features are close by on the genomic sequence, meaning they cluster. Each computed cluster gets its own color. These colors only have a meaning per genome, meaning that a yellow cluster in one genome has no connection to a yellow cluster in the next genome. Another way to cluster the features are different kinds of attributes. Check the radio box for by attribute and choose an attribute in the drop down menu. Press update to change the display.
Description
The description of a subsystem gives an overview of the functional roles and their connections in the subsystem. It can give some background information about the system, what organisms it is usually found in and other facts that are of interest.
Additional Notes
As the description already gives an overview over the subsystem, additional notes can be found here. The notes usually refer to specific properties of some organisms or organism groups, genes that are missing but should be there and other details that might be useful for the interested user.
Scenarios
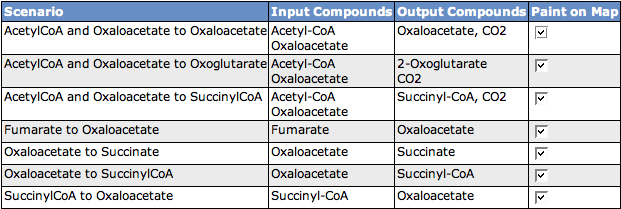
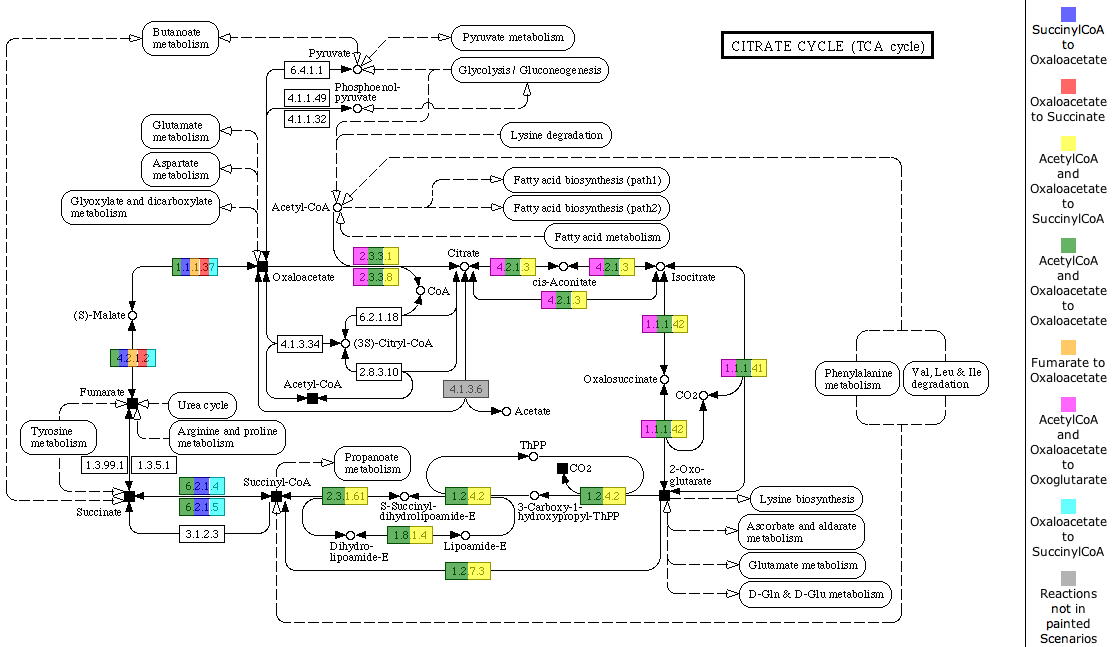
The table shows all scenarios that occur in the subsystem. You can see the scenario name, the Input Compounds, the Output Compounds and a checkbox to decide if you want to see the scenario painted on the KEGG map below. If you change the selection of scenarios to paint on the map, click the button Paint Map(s) to reload the map.
You can also select an organism to highlight on the map. Therefore, click the Select Organism button to get an Organism Select. After choosing an organism, click the button Highlight Reactions for Organism to mark the enzymes present in the organism with black boxes.
The KEGG map is the first tab of a TabView. The header of the tab includes a link to the map at KEGG. Each enzyme in the map is painted with all colors of the scenarios it is part of. A color legend is presented on the right side of the map.
The second tab of the TabView shows all reactions that are not shown on the map, but are part of the subsystem.
