SEED Viewer Manual/OrganismPage
Organism Page
Menu and General Information
Two menus are added to the menu bar when visiting an organism page. These are organism specific menus and described in the Menu Overview.
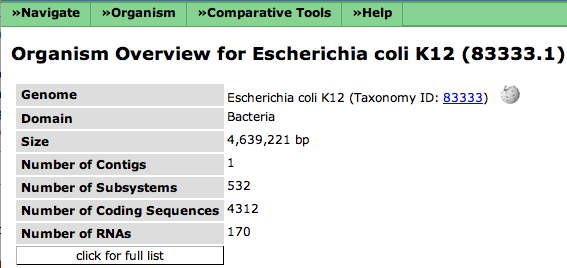
The general information about an organism include name, taxonomy id (linked to NCBI), the domain (Bacteria, Archeae or Eukaryota) as well as some information about the genome (contigs, subsystems, genes). The icon next to the taxonomy id leads to a Wikipedia page for that organism (the icon only shows up if there exists a Wikipedia page).
If you click on click for full list, you will find more specific information about the organism.
Browse, Compare and Download
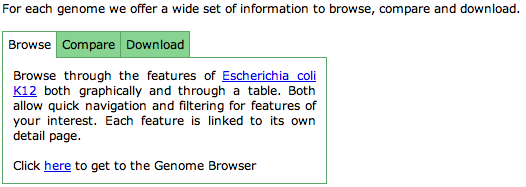
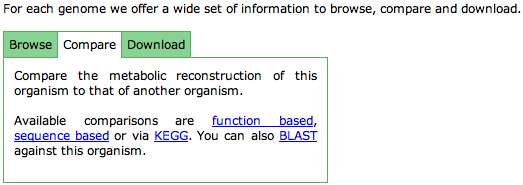
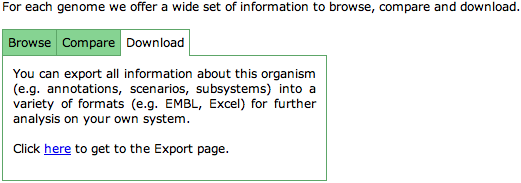
The little TabView next to the general information offers links to browse, compare and download the organism. These function are also available using the Organism menu.
Browse
Clicking the here link will lead to the Genome Browser for the selected organism. It lets you browse the features of your organism.
Compare
Different kinds of comparisons of your selected organism to other organisms are available here (the function-based Compare Metabolic Reconstruction will enable you to see the metabolic reconstruction of your selected organism against that of another one. The sequence-based Multi Genome Compare shows a table and a graphics comparing a selected set of organisms projected against your chosen one (BLAST-based). To project the metabolic capabilities of your organism on KEGG maps, use link to the KEGG page. Blasting against your organism is enabled using the BLAST link.
Download
This tap provides a link to the Download Organism page.
Subsystem Information
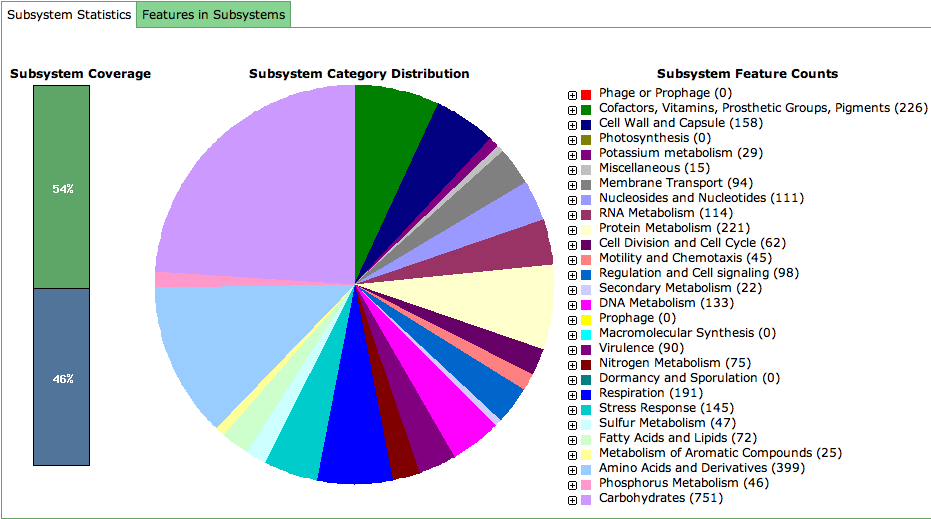
This part of the Organism Page deals with the subsystems present in your organism. The information is organized in a tab view, where the first tab shows a graphical overview of the subsystem information, while the second part lists all proteins in subsystems in a Table.
(1) Graphical overview
The leftmost bar chart (Subsystem Coverage) depicts the percentage of proteins from the selected organism that are in subsystems.
In the middle the pie chart shows the distribution of subsystem categories in the organism. Hovering over the slices will inform you about the category you're looking at and the number of genes that fall in that category.
