Difference between revisions of "SEED Viewer Manual/Subsystems"
| Line 14: | Line 14: | ||
=== Functional Roles === | === Functional Roles === | ||
| + | |||
| + | This [[WebComponents/Table|table]] lists all functional roles present in the subsystem. The first column shows '''Group Aliases''' for the functional role. Functional roles can be aggregated in groups (subsets). Subset names that start with a '*' contain alternative ways to implement a function. | ||
| + | |||
| + | The abbreviation ('''Abbrev.''') for a functional role must be unique for the functional roles in the subsystem. They are used in different displays like the Diagram or the Speadsheet. | ||
| + | |||
| + | The third column lists the full name of the functional role. EC-Numbers are often part of the functional role (for enzymes), and are stated in parentheses after the name of the functional role. | ||
| + | |||
| + | The following two columns deal with reactions a functional role is connected to. Clicking on the link opens a new window showing the KEGG reaction. Next to annotator-curated KEGG reactions, we show the KEGG reactions of the curation effort of the Hope College team that collaborate with the SEED. | ||
| + | |||
| + | GeneOntology (GO) links are displayed in the next column. The links point to the GO-number in GeneOntology's Amigo-Tool. | ||
| + | |||
| + | |||
[[Image:SubsystemFRs.png]] | [[Image:SubsystemFRs.png]] | ||
Revision as of 09:58, 25 November 2008
Subsystems
A subsystem is a collection of functional roles that are associated to each other in a system. Such a system can be a metabolic pathway, a component if a cell like a secretion system and others.
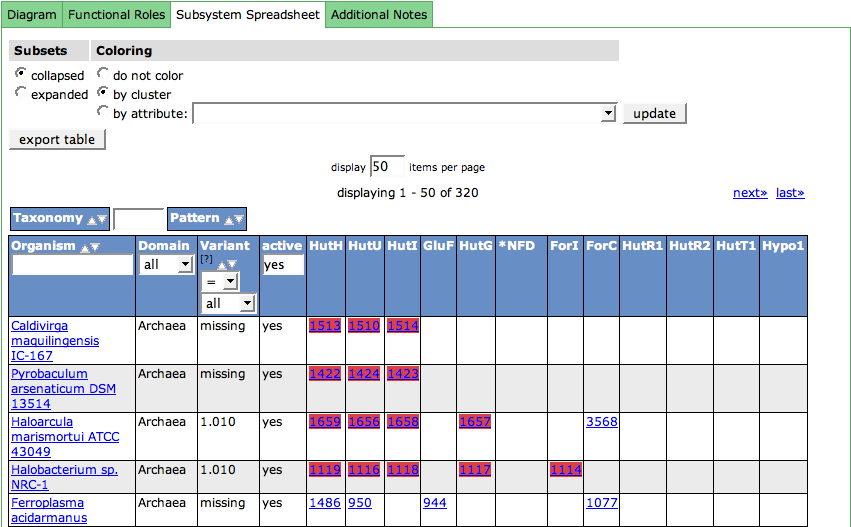
The subsystem page in the SeedViewer is divided into different parts via a TabView. The TabView can consist of 3-5 tabs. The first tab shows a Diagram of the subsystem, the second tab displays a table with the Functional Roles present in the subsystem. The Spreadsheet showing relating the functional roles in the subsystem to features in genomes can be found in the third tab. The fourth and fifth tab show a description and additional notes to a subsystem. They only appear if a subsystem has a description / notes.
Diagram
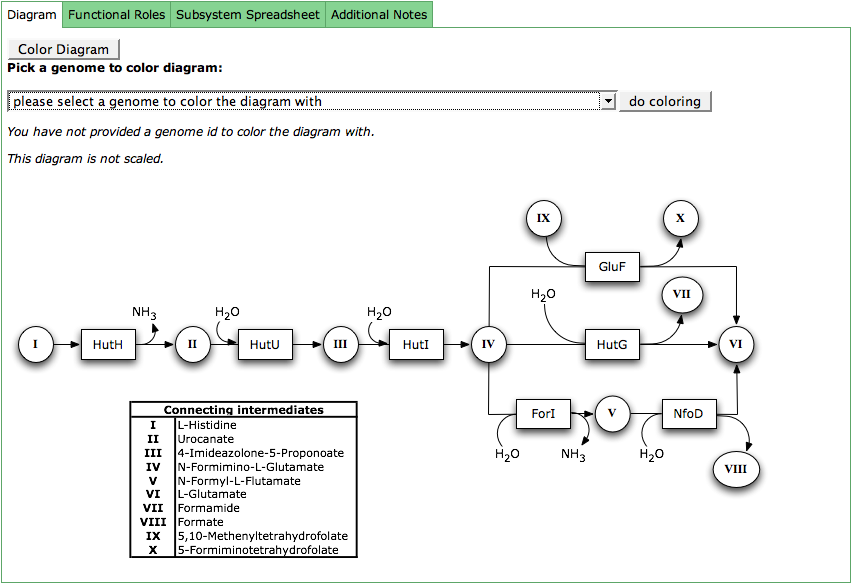
The subsystem diagram shows the connections between the functional roles in a subsystem. The boxes represent the functional roles via their abbreviations. The circles are connecting intermediates, that are described in the table which is part of the diagram.
The functional roles in the diagram can be colored according to their presence in a genome. Click the button Color Diagram to get a combo box with all genomes in the subsystem. Select your genome of interest and press do coloring. The boxes for the functional roles defined for that genome will now be colored in green.
Functional Roles
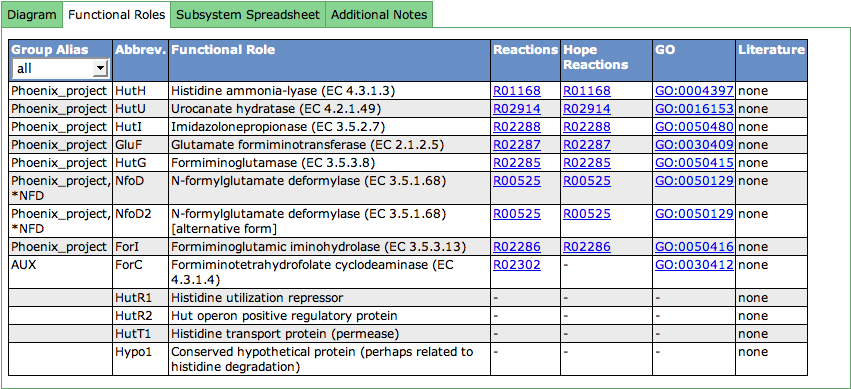
This table lists all functional roles present in the subsystem. The first column shows Group Aliases for the functional role. Functional roles can be aggregated in groups (subsets). Subset names that start with a '*' contain alternative ways to implement a function.
The abbreviation (Abbrev.) for a functional role must be unique for the functional roles in the subsystem. They are used in different displays like the Diagram or the Speadsheet.
The third column lists the full name of the functional role. EC-Numbers are often part of the functional role (for enzymes), and are stated in parentheses after the name of the functional role.
The following two columns deal with reactions a functional role is connected to. Clicking on the link opens a new window showing the KEGG reaction. Next to annotator-curated KEGG reactions, we show the KEGG reactions of the curation effort of the Hope College team that collaborate with the SEED.
GeneOntology (GO) links are displayed in the next column. The links point to the GO-number in GeneOntology's Amigo-Tool.


