Difference between revisions of "SEED Viewer Manual/MultiGenomeCompare"
(→Result) |
(→Result) |
||
| Line 27: | Line 27: | ||
[[Image:MCGResulta.png]] | [[Image:MCGResulta.png]] | ||
| + | The colored table below shows the outcome of the bidirectional BLAST comparisons between each comparison genome and the reference genome, projected on the reference genome. The colors in the table depicts the '''Percent protein sequence identity''' of each gene to it's ortholog in the reference genome. The legend on top of the table describes the coloring. | ||
| + | [[Image:MCGResultb.png]] | ||
| − | |||
| − | |||
[[Image:MCGResultc.png]] | [[Image:MCGResultc.png]] | ||
Revision as of 10:23, 1 December 2008
Multi Genome Compare
This page provides a way to compare a chosen organism against on or many others on the basis of the feature sequences (protein).
Start the computation
To start a Multi Genome Comparison, you have to fulfill three steps:
1) Select Reference Genome
The reference genome is used as a basis for the comparison. All selected genomes (step 2) will be projected on this one. Click here to see how to select an organism.
2) Select Comparison Organisms
You can select maximal four organisms to project on the reference genome.
3) Compute
Press compute to start the computation. This may take while, as the system computes a bidirectional BLAST comparison of each genome to the reference genome.
Result
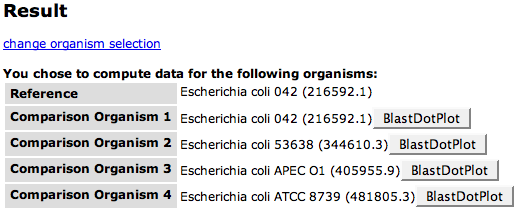
At the top of the result page you will see a list of the genomes involved in the comparison again. After each comparison genome, there is a button BlastDotPlot that leads to a dot plot of the BLAST comparison between the comparison organism and the reference genome.
You can use the link change organism selection on top of the table if the selection does not fit.
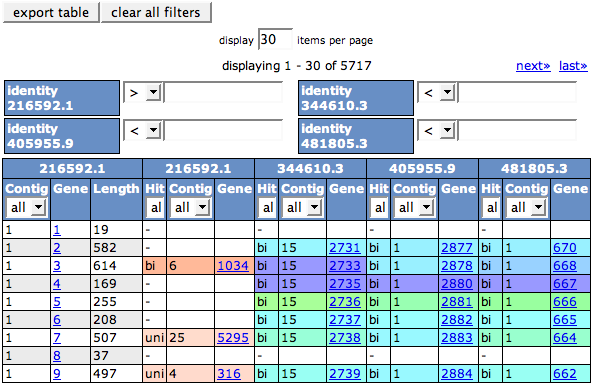
The colored table below shows the outcome of the bidirectional BLAST comparisons between each comparison genome and the reference genome, projected on the reference genome. The colors in the table depicts the Percent protein sequence identity of each gene to it's ortholog in the reference genome. The legend on top of the table describes the coloring.


