Difference between revisions of "SEED Viewer Manual/Annotation"
| Line 53: | Line 53: | ||
In the cell '''Genome Selection''' you can choose to ''collapse close genomes''. For many organism groups, the SEED database contains a number of strains that do not differ too strongly. They can be removed from the display using this option. | In the cell '''Genome Selection''' you can choose to ''collapse close genomes''. For many organism groups, the SEED database contains a number of strains that do not differ too strongly. They can be removed from the display using this option. | ||
| − | The genomes in the display can be sorted by ''Phylogeny'' or ''Phylogenetic distance to input CDS''. In the first case, the genome of the selected peg may not appear on the first line any more, but the genomes in the display are sorted by the overall phylogeny. The second (default) options will show the selected | + | The genomes in the display can be sorted by '''Phylogeny''' or '''Phylogenetic distance to input CDS'''. In the first case, the genome of the selected peg may not appear on the first line any more, but the genomes in the display are sorted by the overall phylogeny. The second (default) options will show the selected CDSs region on the first line and the other genomes in order of phylogenetic distance to the peg. |
| + | |||
| + | The '''Evalue cutoff for selection of pinned CDSs''' depicts the minimum similarity CDSs may have to the selected CDS so that the it's region is displayed. | ||
[[Image:AnnotationAdv.png]] | [[Image:AnnotationAdv.png]] | ||
[[Image:AnnotationTabl.png]] | [[Image:AnnotationTabl.png]] | ||
Revision as of 06:28, 24 November 2008
Annotation
The Annotation page shows a variaty of information about a single feature like a protein or an RNA. The page is roughly divided into three parts. The Annotation Overview presents the basic information about the feature. Reasons for Current Assignment reflect why the feature was assigned with the current functional role. The third part is a Compare Regions View showing the region of the feature in context to its own and related genomes.
If you are logged in and the feature belongs to your private genome, this page will have additional options for you to annotate the feature. These are described here.
The Annotation Overview
The feature ID and the genome it belongs to are shown in the header line of this part of the page. They link to Genome Browser and the Organism Page, respectively.
The current annotation depicts the functional role that is currently assigned to the feature. As annotations can be changed by users, you have the option to view an annotation history by pressing the show button in the cell annotation history some rows below. It will open a small table listing the date, the curator and the annotation that was made for each entry.
As the genome name for the feature is already presented in the header of this section, we additionally show the taxonomy id for that genome in the overview. The link will lead to the Taxonomy Browser at the NCBI showing the taxonomy information for that genome. Behind the taxonomy for the genome you can find the contig the feature can be found on.
The internal links you can see in the next row are leading to different pages containing other views and information for the feature. The Genome Browser (genome browser) displays the feature in the context of its genome. evidence leads to the Evidence page showing evidence for the annotation of the feature in form of Similarities and protein domains. Downloading the actual sequence for the feature is possible using the Sequence Page (sequence) link.
Behind the external links you find a link to the ACH essentially identical genes. This link leads to the Annotation Clearing House, a collection of proteins from many different sources. Proteins that have essentially the same sequence are grouped. For a given ID, you can see all IDs from different sources that belong to this group.
At PubMed Links you can see the PubMed IDs to papers linked to the NCBI Entrez Database. The PubMed IDs shown are direct literature links attached directly to a feature, so-called dlits.
FIGfams are protein families based on the subsystems technology. If you find an entry in this fields, the feature is part of the stated FIGfam. The link leads to the FIGfam Viewer.
database cross references link the feature to its entries (Aliases) in other databases like UniProt, GenBANK and many others.
To gain more information about a feature, you can run different tools (e.g. PSI-BLAST, InterPro and many others) on your feature. Select a tool and press the button run tool.
Reasons for Current Assignment
To gain a clue about what evidence an assignment of a functional role to your feature is based on, the text in Reasons for Current Assignment summarizes important information supporting the annotation. Additional to the information in the overview table, a list of indirect literature (ilits) is decribed in the text. Those are based on direct literature to similar features that have the same functional role.
Compare Regions
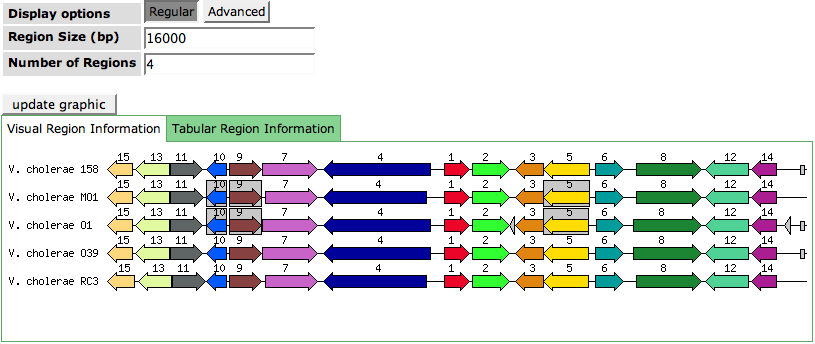
The first line of the Compare Regions is a graphical display of the region of the feature its genome. All proteins are shown as colored arrows, where the direction depicts the strand of the feature. RNAs and other features are small boxes on the line. If two features overlap, the overlapping will be drawn on an (invisible) second line.
The graph is centered on the selected feature (numbered 1), which is always colored red. Below you find the same region for orthologs in other (related) organisms, also colored in red. The colors of the other features (as well as the numbers) also represent ortholog (or sometimes also paralog) features. Whenever there are at least two ortholog or paralog features of a kind, a color (and a number) is assigned to them.
Display Options are divided into two Regular and Advanced.
In the Regular options, you can change the Region Size and the Number of Regions. Changing the Region Size enables to zoom in or out of the region. Changing the Number of Regions will add or remove genomes to your display. Click update graphics to change the display. The numbers that you put in for these values will be saved as preferences.
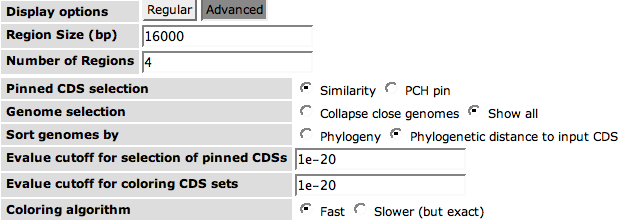
If you click Advanced options, you will see the default options that are used for the Compare Regions View. The Pinned CDS Selection refers to the chosen peg and its orthologs in other genomes. The selection of genomes to show in the graphics can be made by Similarity or PCH pin. The default is Similarity and means that the genomes are chosen using the similarity of the selected genes to its orthologs in other genomes. A PCH means a pair of close homologs. [...]
In the cell Genome Selection you can choose to collapse close genomes. For many organism groups, the SEED database contains a number of strains that do not differ too strongly. They can be removed from the display using this option.
The genomes in the display can be sorted by Phylogeny or Phylogenetic distance to input CDS. In the first case, the genome of the selected peg may not appear on the first line any more, but the genomes in the display are sorted by the overall phylogeny. The second (default) options will show the selected CDSs region on the first line and the other genomes in order of phylogenetic distance to the peg.
The Evalue cutoff for selection of pinned CDSs depicts the minimum similarity CDSs may have to the selected CDS so that the it's region is displayed.


