Difference between revisions of "SEED Viewer Manual/BLASTDotPlot"
Jump to navigation
Jump to search
| Line 3: | Line 3: | ||
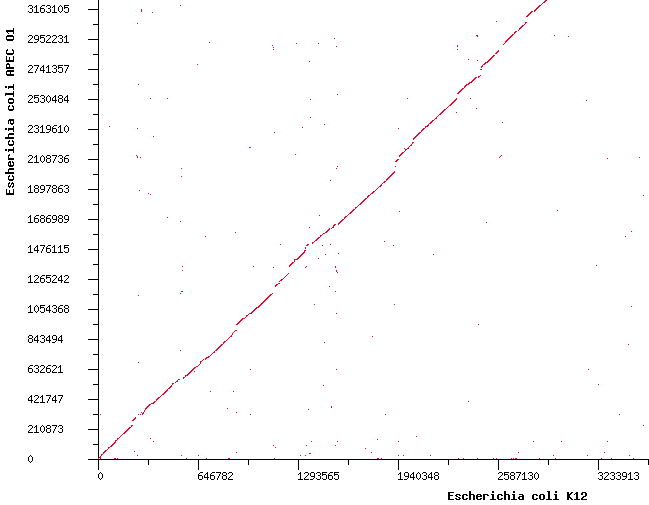
This page shows a bidirectional comparison of two genomes. The data computed for the comparison is a protein-based BLAST of the features of the two genomes. The dot plot displays all bidirectional protein hits between the two genomes. In the example, the two genomes are very close, which results in a diagonal line. | This page shows a bidirectional comparison of two genomes. The data computed for the comparison is a protein-based BLAST of the features of the two genomes. The dot plot displays all bidirectional protein hits between the two genomes. In the example, the two genomes are very close, which results in a diagonal line. | ||
| − | If you are interested in a certain region of the plot, you can select a window in the plot using the left mouse button. The coordinates of the region are then put in the text fields above the graphics. You can view this region in the [[SEED_Viewer_Manual/GenomeBrowser|Genome Browser]] for a genome using the button '''display region'''. The region will be pre-selected in the Genome Browser. | + | If you are interested in a certain region of the plot, you can select a window in the plot using the left mouse button. The coordinates of the region are then put in the text fields above the graphics. You can view this region in the [[SEED_Viewer_Manual/GenomeBrowser|Genome Browser]] for a genome using the button '''display region'''. The region will be pre-selected in the [[SEED_Viewer_Manual/GenomeBrowser|Genome Browser]]. |
[[Image:BLASTDotPlot1.png]] | [[Image:BLASTDotPlot1.png]] | ||
[[Image:BLASTDotPlot2.png]] | [[Image:BLASTDotPlot2.png]] | ||
Latest revision as of 04:41, 2 December 2008
BLAST Dot Plot
This page shows a bidirectional comparison of two genomes. The data computed for the comparison is a protein-based BLAST of the features of the two genomes. The dot plot displays all bidirectional protein hits between the two genomes. In the example, the two genomes are very close, which results in a diagonal line.
If you are interested in a certain region of the plot, you can select a window in the plot using the left mouse button. The coordinates of the region are then put in the text fields above the graphics. You can view this region in the Genome Browser for a genome using the button display region. The region will be pre-selected in the Genome Browser.

