Difference between revisions of "SEED Viewer Manual/HomologClusters"
| Line 5: | Line 5: | ||
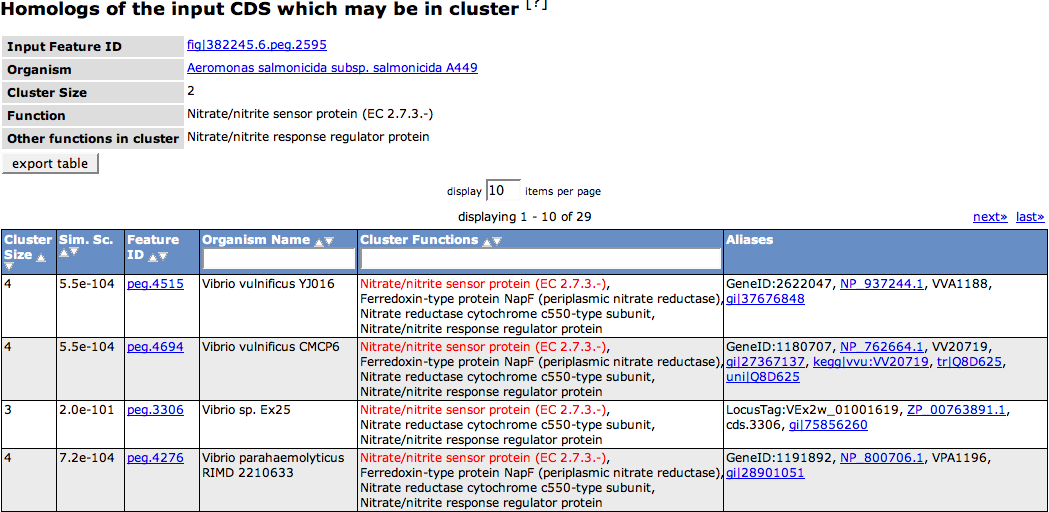
On the top of the page a small table shows some information about the query feature. The '''Input Feature ID''' links to the [[SEED_Viewer_Manual/Annotation|Annotation Page]] for the feature. The '''Organism''' link leads to the respective [[SEED_Viewer_Manual/OrganismPage|Organism Page]]. The '''Cluster Size''' depicts how many features in that organism belong to the computed cluster. The '''Function''' of the query peg is depicted next, as well as '''Other functions in the cluster''', meaning the functions of the other features in that genome that are computed to belong to the cluster. | On the top of the page a small table shows some information about the query feature. The '''Input Feature ID''' links to the [[SEED_Viewer_Manual/Annotation|Annotation Page]] for the feature. The '''Organism''' link leads to the respective [[SEED_Viewer_Manual/OrganismPage|Organism Page]]. The '''Cluster Size''' depicts how many features in that organism belong to the computed cluster. The '''Function''' of the query peg is depicted next, as well as '''Other functions in the cluster''', meaning the functions of the other features in that genome that are computed to belong to the cluster. | ||
| − | The following table of all features in the computed homolog cluster shows you the same information for each feature, as well as '''Aliases''' for that features in other databases. | + | The following table of all features in the computed homolog cluster shows you the same information for each feature, as well as '''Aliases''' for that features in other databases. The column '''Cluster Functions''' includes the functions of the stated feature, which is marked in red. |
[[Image:HomologClusters.png]] | [[Image:HomologClusters.png]] | ||
Latest revision as of 09:05, 24 November 2008
Homolog cluster
This page shows the homolog cluster table for a given feature, where homology is inferred by similarity score. The cluster is computed using Functional coupling as a basis. For a given organism, only features which are in clusters are considered, and only a single feature (the one with the best similarity score) is reported. The table consists of maximal 50 homolog features, and the evalue cutoff is e -10.
On the top of the page a small table shows some information about the query feature. The Input Feature ID links to the Annotation Page for the feature. The Organism link leads to the respective Organism Page. The Cluster Size depicts how many features in that organism belong to the computed cluster. The Function of the query peg is depicted next, as well as Other functions in the cluster, meaning the functions of the other features in that genome that are computed to belong to the cluster.
The following table of all features in the computed homolog cluster shows you the same information for each feature, as well as Aliases for that features in other databases. The column Cluster Functions includes the functions of the stated feature, which is marked in red.
