Difference between revisions of "SEED Viewer Manual/Evidence"
| Line 33: | Line 33: | ||
[[Image:EvidenceHoverSim.png]] | [[Image:EvidenceHoverSim.png]] | ||
| − | To change the evidence view with respect to the sorting and the filtering of the hits, you can find a little control box on top of the similarity graphics. '''Max Sims''' is the number of similarities that are listed on the page. '''Max E-Value''' filters out all similarities that have a higher E-Value than stated here. In the little combo box below these two values, you can decide to see only hits against the SEED database ('''Just FIG IDs'''), or also against other databases ('''Show all Databases'''). You can '''Sort''' the '''Results By''' ''Score'', ''Percent Identity'' (default) or ''Score per position''. | + | To change the evidence view with respect to the sorting and the filtering of the hits, you can find a little control box on top of the similarity graphics. '''Max Sims''' is the number of similarities that are listed on the page. '''Max E-Value''' filters out all similarities that have a higher E-Value than stated here. In the little combo box below these two values, you can decide to see only hits against the SEED database ('''Just FIG IDs'''), or also against other databases ('''Show all Databases'''). You can '''Sort''' the '''Results By''' ''Score'', ''Percent Identity'' (default) or ''Score per position''. These values locally refer to the hit as known from BLAST hits, so a high percent identity referring to a very small hit region can make this similarity show up as one of the first hits, as shown in the example. |
[[Image:EvidenceFil1.png]] | [[Image:EvidenceFil1.png]] | ||
Revision as of 06:33, 25 November 2008
The Evidence Page is divided into two parts via a TabView: The Visual Protein Evidence and the Tabular Protein Evidence.
Visual Protein Evidence
After loading the Evidence Page, the first tab of the TabView is selected. It visually shows different pre-computed tool results for the given feature. In this view, you can see evidence for Location of the product of the gene in the cell, evidence for protein Domains and evidence that show Similarities to other features.
Location
Location stand for location of the product of the feature in the cell. This section presents output for tools that look for transmembrane helices (TM) or signal peptides (SP) in the feature. In the example, you can see five transmembrane helices in the protein identified via the Phobius tool. They are visualized as little boxes, and their location on the line depicts the location of the transmembrane helices in the protein.
Domains
This section shows pre-computed domains for the selected feature. In the example, you can find a CDD domain and a Pfam domain for the feature. The blue bar marks the location of the domain found in the protein (the line depicts the whole length of the protein).
Additional tools can be accessed via the Feature Tools Menu in the menu bar.
Similarities
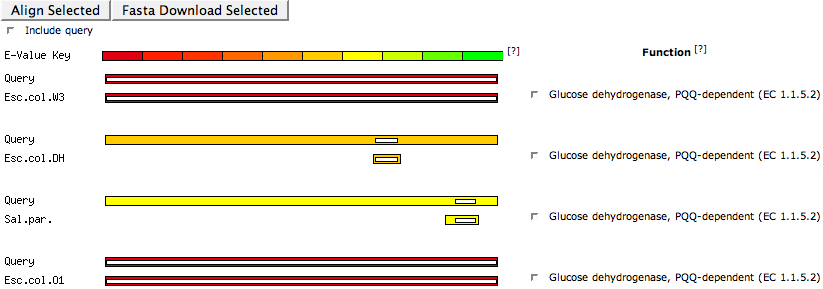
This section graphically lists evidence for similarities to other features in the SEED database (or also other databases). The E-Value Key shown on the top defines the colors that are used to display different E-Value ranges for the similarities to the hit features. Hovering over the E-Value Key shows the value range for each color.
Each similarity is represented by two bars, showing the alignment of the similarity. The first bar is the query feature, the second the hit feature. The abbreviation in front of this bar informs you about the organism the hit feature is in. Hover over the abbreviation to get the complete organism name. Behind the box you can find the functional role of the hit feature.
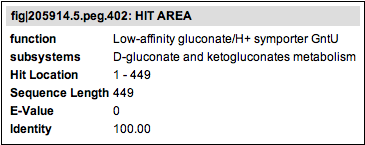
The length of the outside box shows the complete length of the respective sequence. The color of the outside box represents the range of the evalue score according to the E-Value Key bar. The length of the inner (white) box depicts the actual section of the sequence the similarity to the other feature is in. Hovering over the box will show you some information about the hit feature (see tooltip graphics below), including the functional role, the subsystems and some values describing the hit area.
If you check some of the checkboxes in front of the functional role descriptions of the hit genes, you can access two function via the buttons on top of the Similarity graphics. The button Align Selected leads to an alignment page showing a TCoffee alignment for the selected features. FASTA Download Selected lets you download the selected sequences in aminoacid FASTA format.
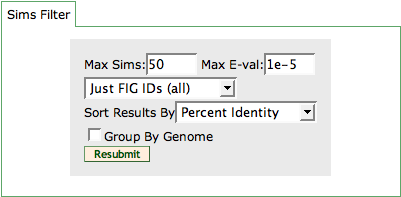
To change the evidence view with respect to the sorting and the filtering of the hits, you can find a little control box on top of the similarity graphics. Max Sims is the number of similarities that are listed on the page. Max E-Value filters out all similarities that have a higher E-Value than stated here. In the little combo box below these two values, you can decide to see only hits against the SEED database (Just FIG IDs), or also against other databases (Show all Databases). You can Sort the Results By Score, Percent Identity (default) or Score per position. These values locally refer to the hit as known from BLAST hits, so a high percent identity referring to a very small hit region can make this similarity show up as one of the first hits, as shown in the example.
Tabular Protein Evidence
Similarities
Domains
This section shows pre-computed domains for the selected feature. In the example, you can find a CDD domain and a Pfam domain for the feature. The blue bar marks the location of the domain found in the protein (the line depicts the whole length of the protein).
The table lists the Domain DB (the database for the domain that was hit), the ID in the domain database, the Name of the domain, the Location of the hit in the selected feature, the Score for the hit against the domain, as well as the Function of the domain.
The table can be exported using the export table button.
Additional tools can be accessed via the Feature Tools Menu in the menu bar.
Identical Proteins
Essentially Identical Proteins are proteins that share a common sequence, but the start position of the proteins may vary a little. This definition was made because in different databases or close strains of organisms, it often happens that a protein is present, but the start position may be shifted in the finding genes step. So essentially, this table shows aliases of the feature that were based on protein identity.
The first column of the table shows the Database the alias can be found in, while the second column (ID) offers the alias name and a link to the protein in the respective database. The following two columns describe the Organism and the Assignment for the feature for the alias.
Functionally Coupled
This table lists all functionally coupled genes in the organism. You can see the Score, the ID of the feature and the Function of the feature.


