Difference between revisions of "SEED Viewer Manual/ContigView"
| Line 1: | Line 1: | ||
== Contig View == | == Contig View == | ||
| + | |||
| + | This page shows a window of the Contig centered on a selected feature. The window is described in the top table. It names the '''Organism''' and '''Contig Length''' for the feature. The '''Start Base''' and '''End Base''' of the window and the resulting '''Region Length''' is shown. The '''Region GC Content''' is computed for that window. | ||
| + | |||
| + | For the selected feature, the second table gives you the Protein ID ('''Protein of Interest Region'''), the '''Contig''' name, as well as the '''Start Codon Location''' and the '''Stop Codon Location'''. | ||
[[Image:ContigView1.png]] | [[Image:ContigView1.png]] | ||
| + | |||
| + | The graphic displays the window in a six-frame view. You can use the horizontal scroll bar to navigate the window. | ||
| + | |||
| + | The DNA sequence for both strands is displayed in small colored letters. The four bases are colored as follows: ''t'' - blue, ''c'' - red, ''a'' - purple and ''g'' - green. Background colors are used to mark possible '''Start Codons''' (yellow) and '''Shine-Dalgarno sites''' (green). | ||
| + | |||
| + | Above the forward strand DNA sequence, you can see the translated protein sequences for the three forward strands. A ''*'' marks a stop codon. Below the reverse-strand DNA sequence, the three reverse protein strands are shown. Protein features are displayed in form of boxes on the respective strand. The selected feature ('''Protein of interest''') gets a box with a red background, other features have a box with blue background. | ||
| + | |||
| + | Below the six-frame view, you can find a '''Third GC Codon plot'''. The dotted line is the average GC content for the region. The colored lines are the GC content for the third Codon of the triplets for each strand. | ||
[[Image:ContigView2.png]] | [[Image:ContigView2.png]] | ||
Latest revision as of 12:15, 2 December 2008
Contig View
This page shows a window of the Contig centered on a selected feature. The window is described in the top table. It names the Organism and Contig Length for the feature. The Start Base and End Base of the window and the resulting Region Length is shown. The Region GC Content is computed for that window.
For the selected feature, the second table gives you the Protein ID (Protein of Interest Region), the Contig name, as well as the Start Codon Location and the Stop Codon Location.
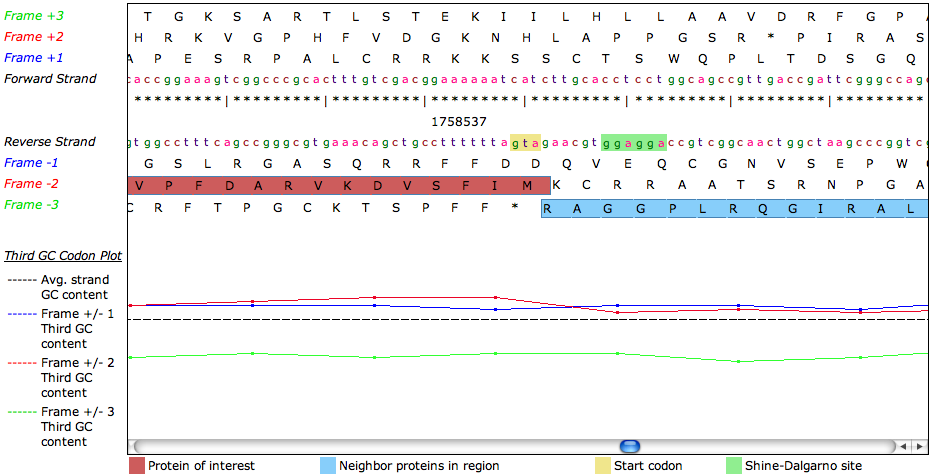
The graphic displays the window in a six-frame view. You can use the horizontal scroll bar to navigate the window.
The DNA sequence for both strands is displayed in small colored letters. The four bases are colored as follows: t - blue, c - red, a - purple and g - green. Background colors are used to mark possible Start Codons (yellow) and Shine-Dalgarno sites (green).
Above the forward strand DNA sequence, you can see the translated protein sequences for the three forward strands. A * marks a stop codon. Below the reverse-strand DNA sequence, the three reverse protein strands are shown. Protein features are displayed in form of boxes on the respective strand. The selected feature (Protein of interest) gets a box with a red background, other features have a box with blue background.
Below the six-frame view, you can find a Third GC Codon plot. The dotted line is the average GC content for the region. The colored lines are the GC content for the third Codon of the triplets for each strand.

